> For the complete documentation index, see [llms.txt](https://docs.cloudeka.ai/llms.txt). Markdown versions of documentation pages are available by appending `.md` to page URLs; this page is available as [Markdown](https://docs.cloudeka.ai/guideline-for-enterprise/deka-cdn/detail-deka-cdn/dashboard-tab.md).
# Dashboard Tab
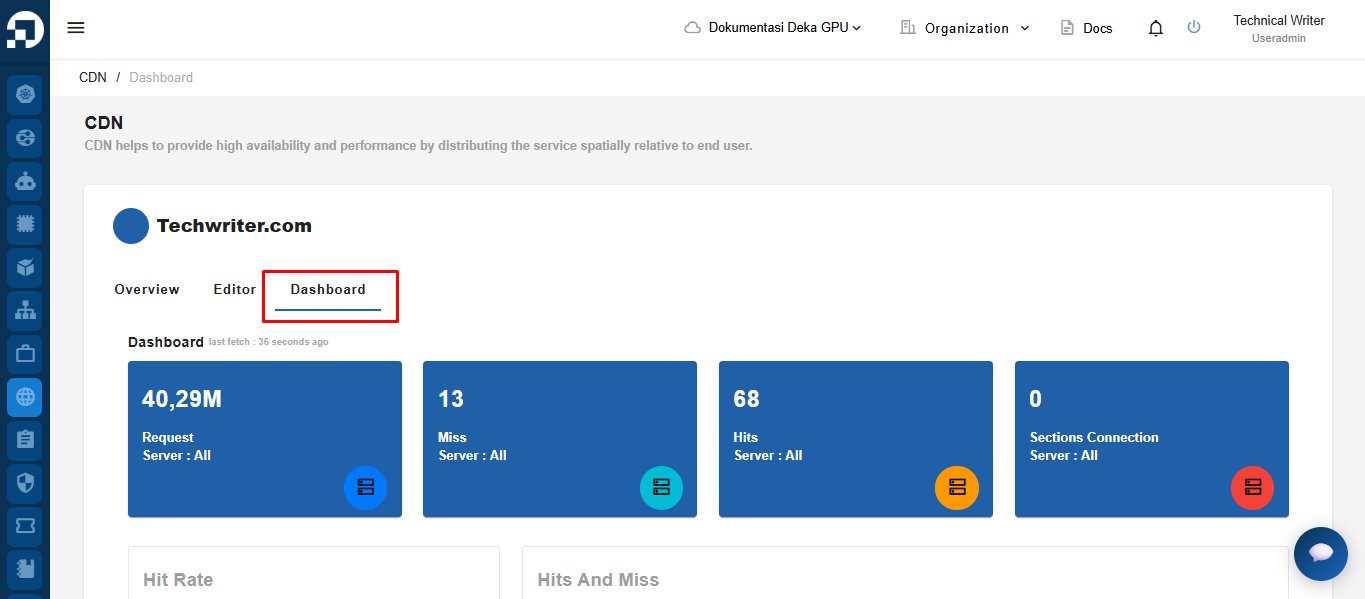
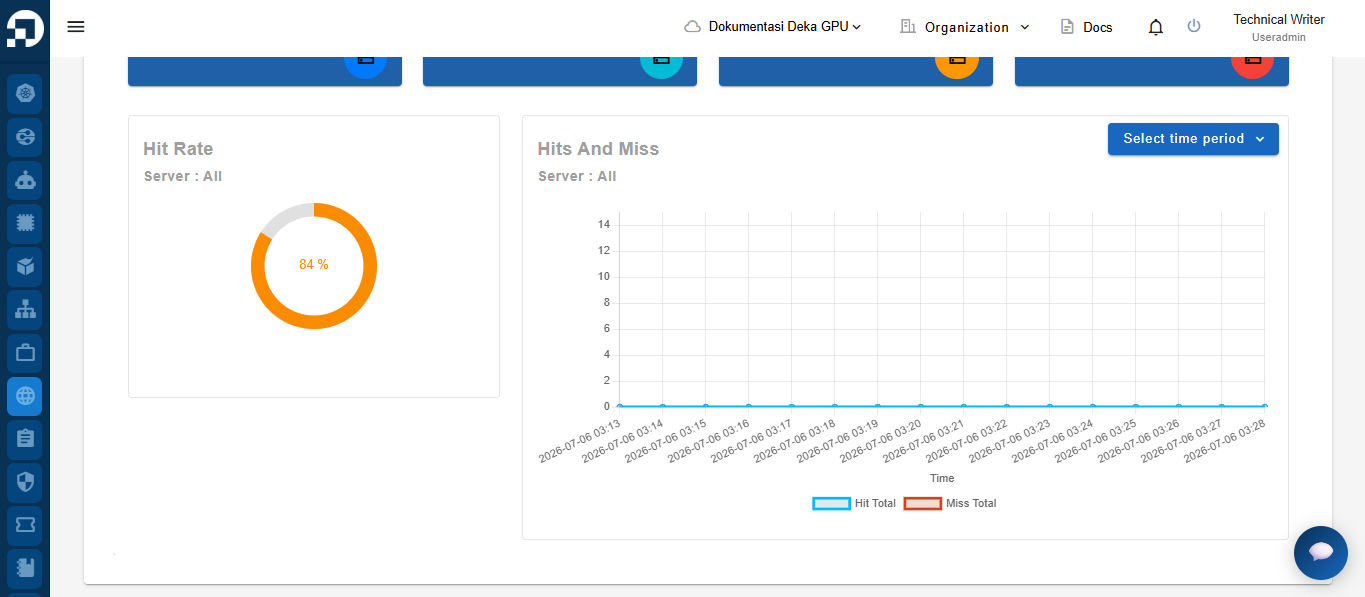
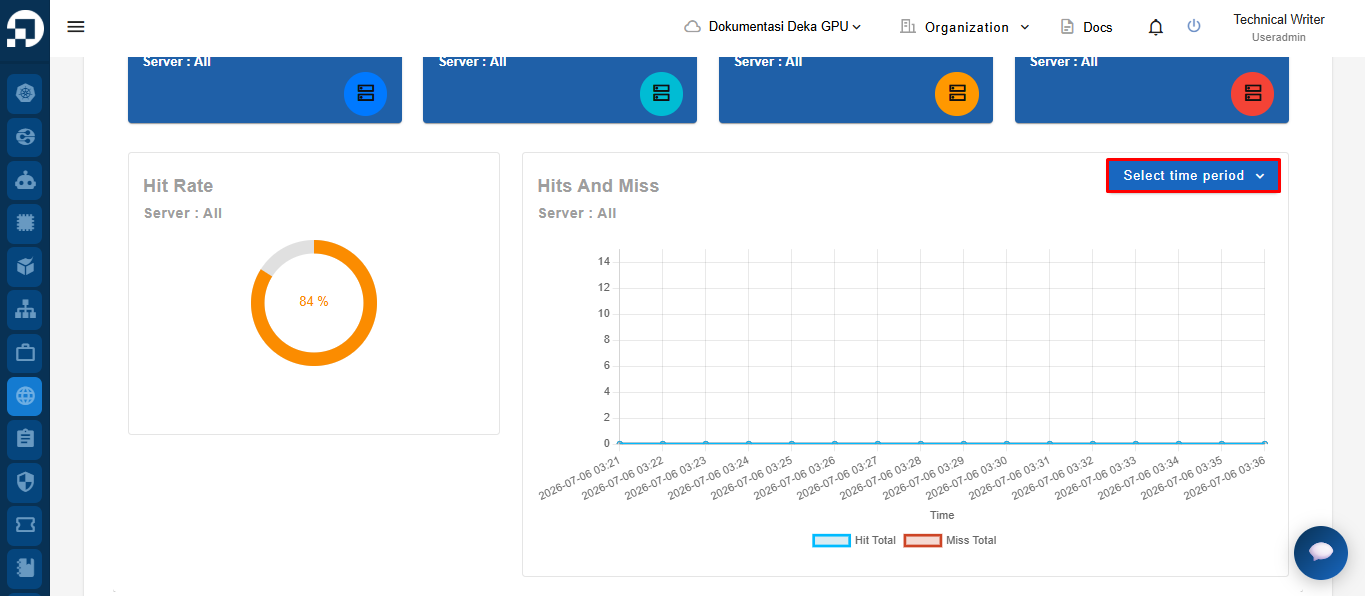
The Dashboard tab presents real-time performance metrics of the service Deka CDN, including the number of requests, cache hits and misses, as well as a hit rate graph that helps monitor the efficiency of content delivery via Deka CDN.
## View Hit Rate
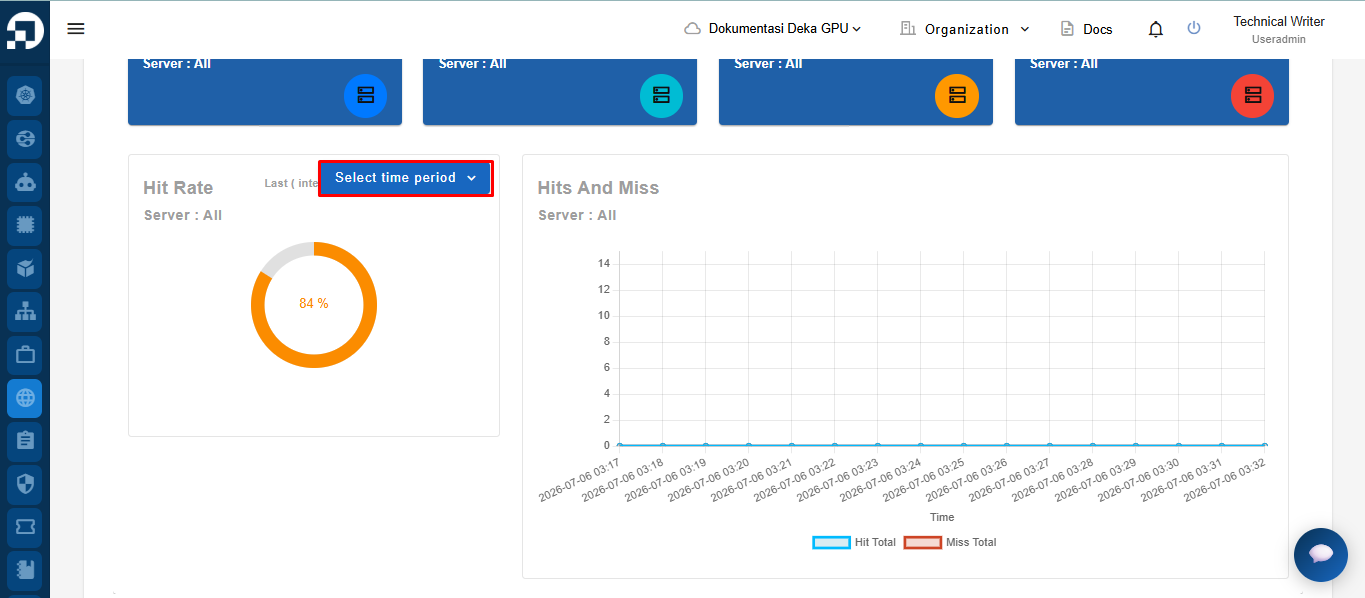
To display the **Hit Rate**, click the *Select time period* drop-down button.
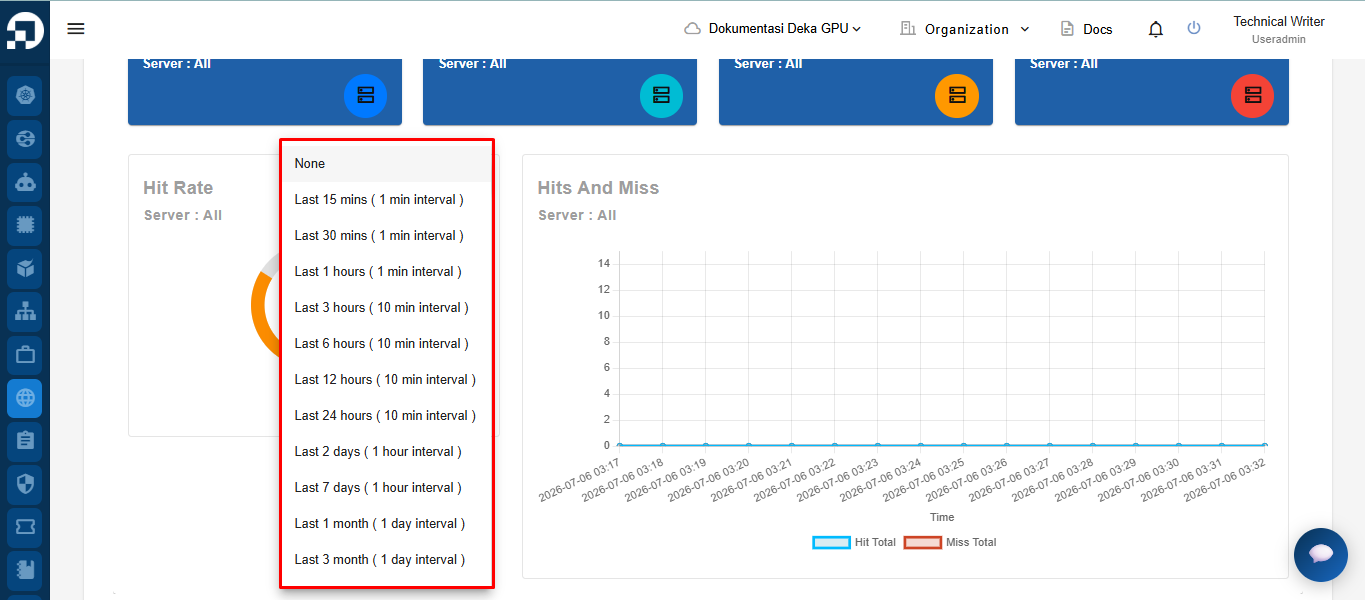
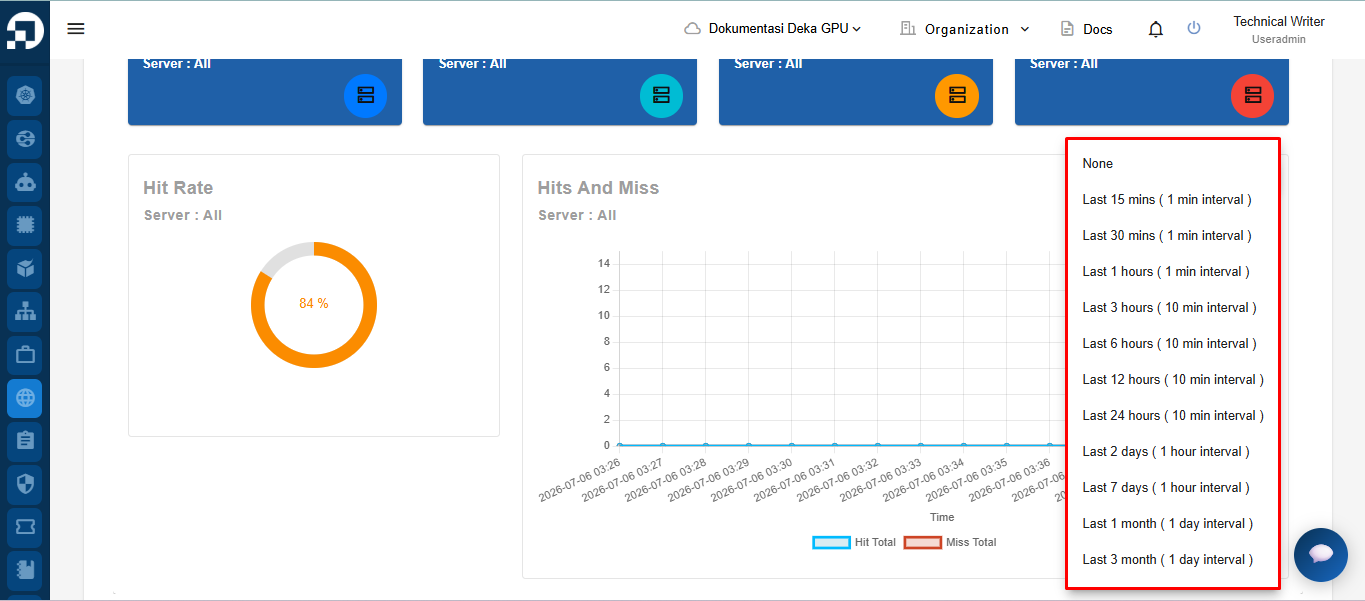
The system displays a list of available time periods. Select the desired time range to view the **Hit Rate** and **Hits and Miss** data.
## View Hits And Miss
To display the chart data, click the ***Select time period*** drop-down to view the available time range options.
The system displays a list of available time ranges. Select the desired time range to display the *Hits And Miss* chart data.